|
|
Rationale |
|
We established a research
and educational partnership to document Wedge-tailed
Shearwater fallout and road mortality along the southeastern
shore of O'ahu, involving four partners:
DOFAW - HPU Pelagicos Lab - U.S. Fish & Wildlife Service - Oikonos

The Wedge-tailed Shearwater ('Ua'u kani, Puffinus pacificus), a seabird protected by both Federal and State statutes, breeds on O'ahu, primarily on the offshore islets along the windward coast. Fledging shearwaters are grounded due to collisions with utility wires, light posts, and other structures. Shearwaters grounded on roadways are often hit by vehicles.
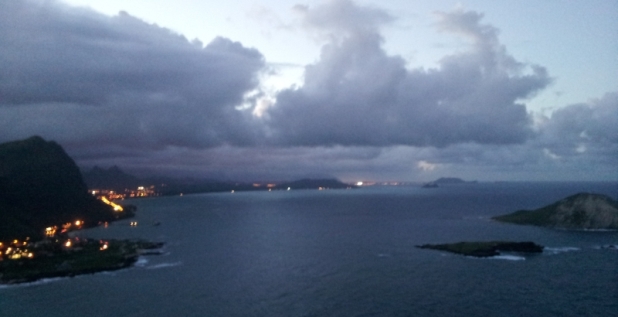
We surveyed a 16-km stretch of the Kalaniana'ole Hwy., spanning from Hawai'i Kai to Olomana Golf Course, (Figure 1), repeatedly during the wedge-tailed shearwater fledging season (Nov. - Dec.) over five years (2011 - 2015) and documented year-to-year changes in the timing and magnitude of shearwater fallout.

| Figure 1. The 16-km survey of the Kalaniana‘ole Hwy, spanning from the Olomana Golf Course (north), through Waimanalo town, to Hawai‘i Kai (south). The map shows the location of the Manana shearwater colony and of the Sea Life Park rehabilitation center. |
In 2011, we documented 128 downed shearwaters during the fledging season (Figure 2). These results highlight the potential for high fallout along the southeast coast of O'ahu, due to the presence of shearwater breeding sites upwind from a seaside highway and urban center (Waimanalo town). These surveys also highlighted the negative relationship between shearwater fallout and moon phase: with significantly more grounded shearwaters during nights with lower moon illumination (Pearson correlation, r = -0.61, n = 17 surveys, p < 0.005).

| Figure 2. Wedge-tailed shearwater fallout (number of downed birds) encountered during standardized surveys of the study area. The open circles denote the survey dates and the blue line depicts the degree of lunar illumination. |
While fallout was widely distributed along the coastline down-wind from Manana Island in 2011, downed shearwaters were concentrated in the vicinity of the Waimanalo Beach Park (Figure 3a), an area characterized by high light post densities (Figure 3b).
 |
 |
Figure 3a. In 2011, we documented 128 grounded shearwaters, with a hotspot of concentration at Waimanalo Beach Park. |
Figure 3b. Map of light densities along the study area, showing the "hotspot" associated with the Waimanalo Beach Park. |
|

Approach
With matching funds from the State of Hawai’i DOFAW, we initiated a multi-year study of Wedge-tailed Shearwater fallout and road mortality along the southeastern shore of O’ahu.
Our overarching goal is to document the timing and location of shearwater fallout during the chick fledging season, and to use this this information to educate the public about the threats faced by fledging wedge-tailed shearwaters.
Over the last four years (2012 - 2015), we have completed the following activities:
(i) surveyed a 16-km section of the Kalaniana'ole Highway, from Hawai'i Kai to Olomana Golf Course, using standardized methods to map shearwater fallout during the fledging season (Nov. 1 - Dec. 21) of four years (2012, 2013, 2014, 2015),
(ii) marked and resighted randomly-selected carcasses at daily intervals to quantify potential biases in the road surveys due to carcass loss by scavenging and washout, and
(iii) disseminated the study results via our project web-site, our facebook site, scientific presentations and public seminars.
It is our hope that these outreach efforts will increase public awareness about shearwater fallout and possible mitigation efforts aimed at reducing mortality. |
 |
A Wedge-tailed Shearwater chick, grounded in Waimanalo town, is documented and taken to Sea Life Park for rehabilitation and release.

|
|
Goals and Objectives
The goal of this project is to develop ways to mitigate Wedge-tailed Shearwater mortality. More specifically, this project focuses on the following objectives:
* Road Surveys: Following the protocol used in 2011, we surveyed a 16-km stretch of the Kalaniana'ole Hwy., every 3 days, during the shearwater fledging season. These surveys provided information on the spatial and temporal distribution of shearwater fallout and mortality along the study area, and highlighted potential “hotposts” of concentrated mortality.
* Carcass Loss Study: To investigate the loss of carcasses due to scavenging and wash out by rains, we marked a randomly selected subset of 54 specimens with color string and number tags. The daily resighting of these marked specimens facilitated mark-recapture data for the development of correction factors to account for scavenging and loss.
* Dissemination of Project Results: We disseminated project findings to a wide audience using a variety of media. In addition to posting our results online, we completed the following activities:
- Seminar at HPU (May 2013):
Disseminated research results to HPU students to stimulate student volunteers for Sea Life Park rehabilitation program.
- Hawai'i Conservation Conference (July 2013):
Devon Francke gave an oral presentation to conservation practitioners and resource managers.
- Public Seminar at Hanauma Bay (October 2013):
Hyrenbach gave a public presentation to stimulate public awareness of the plight of the fledging shearwaters at the Hanauma Bay Lecture Series.
- Pacific Seabird Group Conference (February 2016):
Devon Francke gave an oral presentation to conservation practitioners and resource managers.
|
 |
Fledging shearwaters encounter a range of obstacles along the Kalaniana'ole Highway, including street utility poles, lights, and wires.
|
 |
|
Results
Road Surveys: Throughout the four years (2011 – 2015) of this ongoing study, we have completed 68 surveys of a 16-km section of the Kalaniana'ole Highway, from Hawai'i Kai to Olomana Golf Course, and have documented 231 shearwater carcasses (Table 1).
|
YEAR |
# Carcasses Detected |
Mean (S.D.) / Median (Range) |
Dates of Fallout |
|
2011 |
128 |
7.7 (9.7) / 4
(0 - 30)
|
Nov 14 - Dec
22
|
|
2012 |
60 |
3.5 (2.9) / 3
(0 - 9)
|
Nov 9 - Dec 21
|
|
2013 |
11 |
0.6 (1.0) / 0
(0 - 3)
|
Nov 24 -Dec 9
|
|
2014 |
13 |
0.5 (0.5) / 0
(0 - 1)
|
Nov 18 -Dec 18
|
|
2015 |
19 |
1.1 (1.2) / 1
(0 - 3)
|
Nov 15 - Dec
21
|
|
Total |
231 |
|
|
Table 1. Summary of road surveys conducted yearly from November 3 through December 21, showing the number of shearwater carcasses detected, the mean (S.D.) / median (range) number of carcasses encountered per survey, and the range of dates when fallout was documented. |
Because the number of shearwater carcasses documented during standardized surveys varied widely (from 0 to 30), we log-transformed the data as follows: y’ = log (y + 1). We analyzed the log-transformed data using analysis of variance (ANOVA), with one fixed factor (year) and two covariates (Julian date, and percent of the lunar disk that was illuminated). The ANOVA test revealed that shearwater fallout varied significantly from year to year, and in relation to the lunar cycle; yet, there was no significant date effect (Table 2).
Source |
df |
F-ratio |
P value |
Result |
YEAR |
4 |
1.129 |
< 0.001 |
Year-to-year differences |
DATE |
1 |
0.112 |
0.277 |
No signifficat date effect |
MOON |
1 |
1.656 |
< 0.001 |
Significant lunar effect |
Error |
78 |
|
|
|
Table 2. Analysis of Variance (ANOVA) model results, showing the coefficients and associated p values for the three tested effects: year, date, moon illumination. The bold font denotes significant results. Overall model R squared = 0.45. |
An exploration of yearly patterns of fallout reinforced the important influence of the lunar cycle, as evidenced by the multi-modal distributions, with peak fallout during low moon periods and no fallout during high moon periods (Figure 4). Three of the four years (2011, 2012, 2014, 2015) had bimodal fallout distributions, with a primary and a secondary peak separated by a period of no deposition, when moon light approached 100% of the lunar disk. The fifth year (2013) was characterized by a single peak, preceding the full moon.

Figure 4A-D. Relative fallout (% shearwater carcasses encountered on road) and moon light (% of the lunar disk illuminated), during standardized surveys of the study area (17 surveys per year; highlighted by the open circles).
|
Carcass Loss Study : Live and dead shearwaters were documented using a standardized protocol, and a randomly-selected subset of carcasses were tagged and left on the road, as part of the scavenger removal trial. Over the three years of this study, we marked a randomly–selected subset of 65 shearwater carcasses with an aluminum tag attached to the feet with color string, and left them where they were first encountered. Carcasses were resighted daily, starting in day 1 and until they reached day 9, when they were removed.
The resighting data collected during a four-year study (2012 – 2015) revealed that the loss rate varied as a function of the amount of time the carcass had been left on the road (number of days since first marked), from 23.1% for fresh carcasses (day 1), to 0.0% for old carcasses (day 6 and day 9). Altogether, these results suggest that predators (cats, rats, mongoose) scavenge fresh carcasses, but are less attracted to them after they have been on the road for 3 days (Figure 5).

Figure 5. Probability of resighting a carcass (proxy for loss rate), as a function of the number of days since it was marked. The error bars denote one S.D. above / below the mean, and the numbers in brackets indicate the sample size (number of birds).
|
We synthesized the carcass loss data for the entire study (2012-2015) using a Weibull model, with an additional variable to account for the non-linear influence of time on the resighting probability (Figure 6). The best-fit model had a significant intercept (4.619 +/- 0.059 S.E.), a significant slope (-0.491 +/- 0.068 S.E.) and a significant power exponent (0.788 +/- 0.135 S.E.). Moreover, because the power exponent was different from 1 (t = 5.8270, p = 0.0011), it revealed that the age of a carcass (number of days since marking) had a non-linear influence on the probability of resighting that carcass. Namely, newer and older carcasses were lost at higher and lower rates, respectively.

Figure 6. Cumulative probability of resighting a tagged carcass (proxy for loss rate), as a function of the number of days since marking. The circles show the observations and the lines indicate the 95% Confidence Intervals of the model prediction.
|
|
| |

Pelagicos Contact
David Hyrenbach
Other Pelagicos People
Devon Francke, Dan Rapp, Sarah Youngren, John Johnson
Partners
Norma Creps

|
Keith Swindle

|
Department of Land & Natural Resources
Division of Forestry and Wildlife
1151 Punchbowl Street Rm 325
Honolulu, HI 96813
|
U.S. Fish and Wildlife Service
4401 N Fairfax Drive, MS: LE-3000
Arlington, VA 22203 |
|
|
|
|